Harmonic Trading Ratios Educational (Source Code)This table indicator was intended as educational purpose only for Harmonic Trading Ratios.
The ratios are used for Harmonic AB=CD and XAB=CD.
Ratio calculation are shown for Retracement and Projection based Primary, Primary Derived, Secondary Derived and Secondary Derived Extreme.
Primary Retracement : 0.618
Primary Projection : 1.618
Please take note that Secondary Derived Extreme is only available for Projection.
Indikator berjadual bertujuan sebagai pendidikan sahaja untuk Harmonic Trading Ratios.
Ratio digunakan untuk Harmonic AB=CD and XAB=CD.
Pengiraan ratio untuk Retracement and Projection adalah berdasarkan Primary, Primary Derived, Secondary Derived dan Secondary Derived Extreme.
Primary Retracement : 0.618
Primary Projection : 1.618
Sila ambil perhatian bahawa Secondary Derived Extreme adalah untuk Projection sahaja.
The values shown in table was based on Harmonic Trading: Volume One, Page 18 written by Scott M Carney.
Nilai yang ditunjukkan dalam jadual adalah berdasarkan buku Harmonic Trading: Volume One, Page 18 ditulis oleh Scott M Carney.
Indicator features :
1. List Harmonic Trading Ratios including calculation.
2. Show and draw individual Harmonic Trading Ratio.
3. For desktop display only, not for mobile.
Kemampuan indikator :
1. Senarai Harmonic Trading Ratios termasuk pengiraan.
2. Memapar dan melukis Harmonic Trading Ratio secara berasingan.
3. Untuk paparan desktop sahaja, bukan untuk mobile.
FAQ
1. Credits / Kredit
Scott M Carney,
Scott M Carney, Harmonic Trading: Volume One
2. Code Usage / Penggunaan Kod
Free to use for personal usage but credits are most welcomed especially for credits to Scott M Carney.
Bebas untuk kegunaan peribadi tetapi kredit adalah amat dialu-alukan terutamanya kredit kepada Scott M Carney.
Display for Bullish / Bearish Retracement
Paparan untuk Bullish / Bearish Retracement
Display for Primary Retracement and Primary Projection
Paparan untuk Primary Retracement and Primary Projection
Display for Secondary Derived Extreme Retracement and Secondary Derived Extreme Projection
Paparan untuk Secondary Derived Extreme Retracement and Secondary Derived Extreme Projection
在脚本中搜索" TABLE "

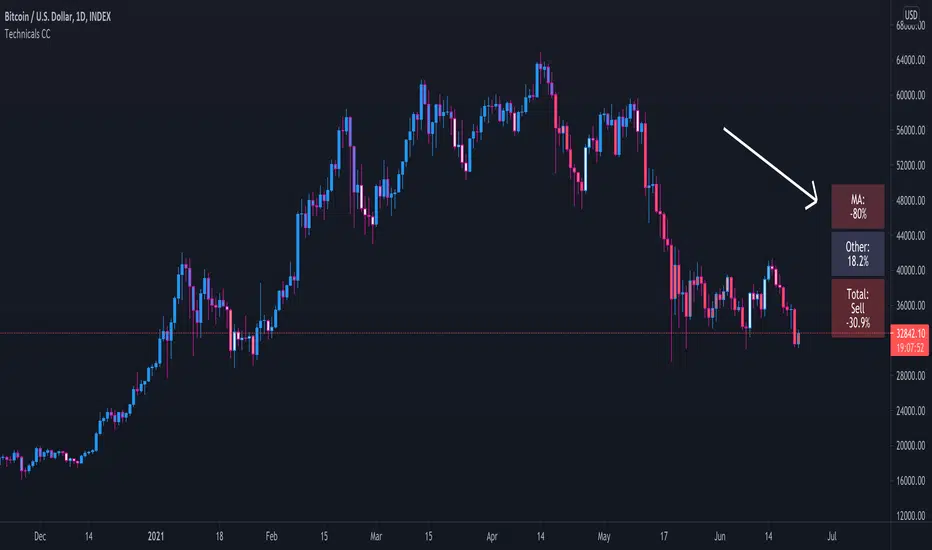
Technical Ratings Colored CandlesFor those that want technical ratings but don't want waste valuable screen real estate. Candles are colored to the rating strength. It also plots the results for "total", "MA" and "other" in a table on right of screen. Table and candle coloring can be turned off in style settings. This script uses the built in Technical Ratings indicator. For more informations on Technical Ratings please refer to official documentation.
ADR% / ATR / LoD dist. TableDisplays the following values in a table in the upper right corner of the chart:
ADR%: Average daily range (in percent).
ATR: Average true range (hidden by default).
LoD dist.: Distance of current price to low of the day as a percentage of ATR.
All values are calculated based on daily bars, no matter what time frame you are currently viewing. Doesn't work for time frames >1D, which is why the table is not shown on weekly/monthly charts.
Credit to MikeC / TheScrutiniser and GlinckEastwoot for ADR% formula

ADR% / AWR% / AMR% / ATR / LoD Dist. TableThis is an updated script from ArmerSchlucker that includes AWR (average weekly range) and AMR (average monthly range) in the table when toggled to those timeframes

Compact Swing Leg Tracker (Strict, Static PB, Compact Table)Simple Swing Leg Tracker is the evolution of the original Simple Swing indicator — rebuilt for smoother leg tracking, cleaner visuals, and added context. It automatically identifies up and down legs in real time, plotting an anchor line at the prior swing point and a live line at the current extreme. The direction flips automatically when price breaks beyond the opposite swing, keeping the chart aligned with the active trend.
It tracks leg size, live pullback %, and the deepest (static) pullback so far in the leg. A compact two-row stats panel displays the current leg metrics on top and the most recent up- and down-leg sizes beneath for quick reference.
Highlights:
Evolution of the Simple Swing indicator
Auto-flip between up/down legs on swing breaks
Real-time pullback and static pullback tracking
Displays last completed up/down leg sizes
Minimal two-line layout (swing + live extreme)
Compact color-coded stats table

SMACD Screener Table (fixed)Attemt to get a table with SMACD-values for filtering on for instance; value crossing (or close) signal and is below 0-line.

Multi-Timeframe RSI TableIt can print RSI values of any four chosen periods in a tabular format on the chart itself. The table can be placed in any of the six positions, as required. If the RSI values are more than 40 or less than 40, these values are shown in bright Red, else it is light Red.

Avg Candle Size Table (Ticks) The average of the last N candles in ticks shown on a table in the top right of the chart


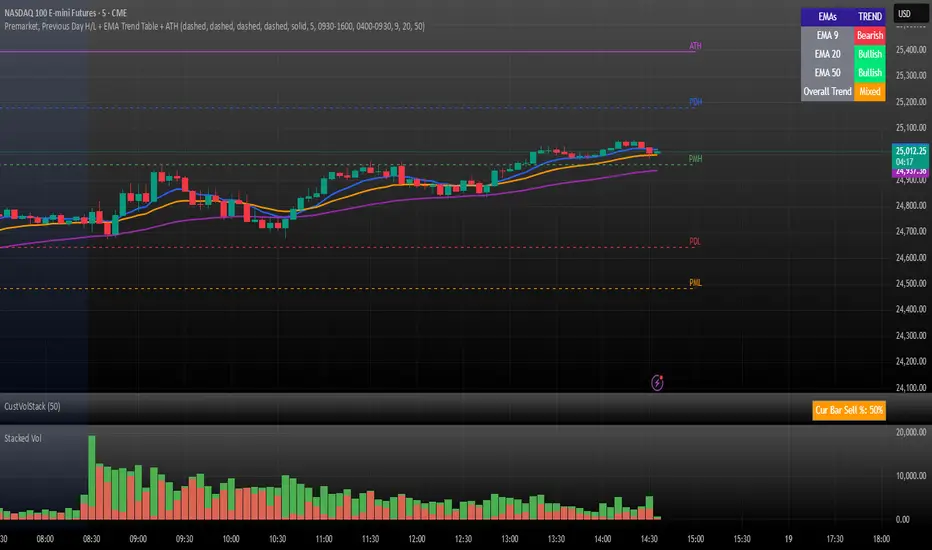
Premarket, Previous Day H/L + EMA Trend Table + ATHPremarket, Previous Day H/L + EMA Trend Table + ATH
Customizable Dashboard (SIMPLE)This is a custom table where you can track any ticker and it's daily change. color coded to make things easy.

Bias Table-manualIt is just at tabular column to manually update Bullish/Bearish for multiple timeframes. Provided date option which is also manual, to denote when the analysis was done and table updated. This will be helpful for multiple stocks/securities analysis on regular basis

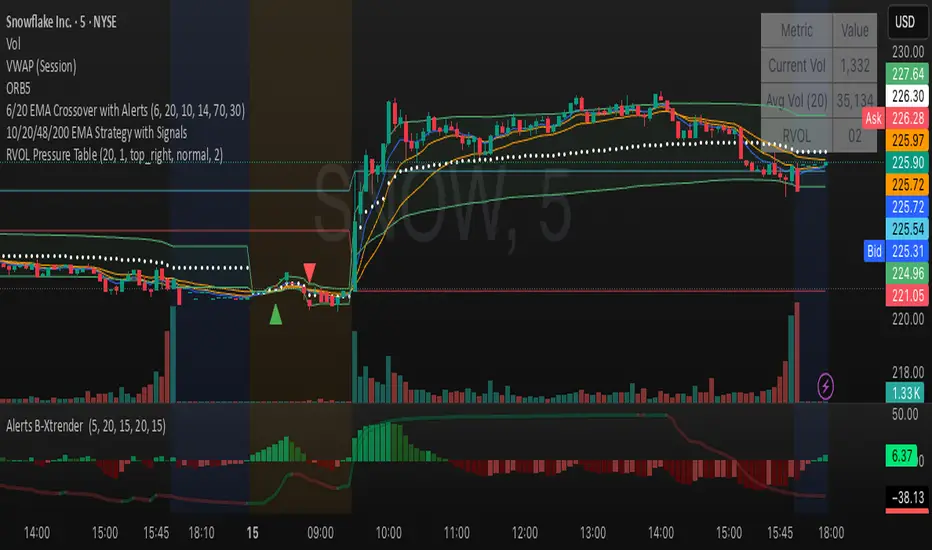
Relative Volume Table with PressureDisplay relative Volume as a table in the top right corner. Turns green when volume is high and price is increasing and red when volume is high and price is decreasing. I use this on D timeframe at the open to screen for stocks breaking out.
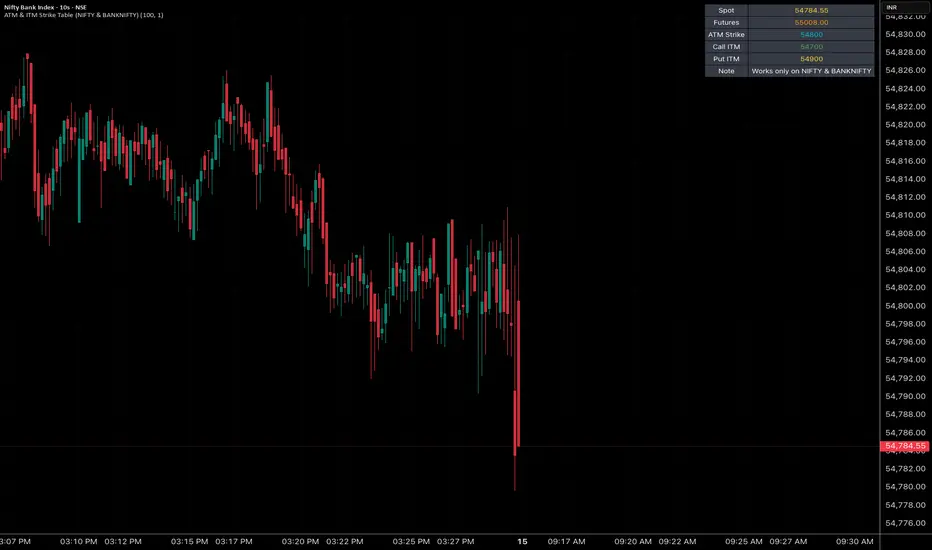
ATM & ITM Strike Table (NIFTY & BANKNIFTY)This script is like a cheat sheet for option traders.
When you put it on your chart, it shows you a small table with:
The current spot price (the real market price).
The futures price (another version of the same index that sometimes trades a bit higher or lower).
The ATM strike (the strike price closest to the market price).
Which call option and put option are “in the money” and most relevant right now.
A little note to remind you if you’re looking at the right chart.
In short:
It saves you from doing mental math every time by automatically pointing out the key option strike prices you should be aware of.
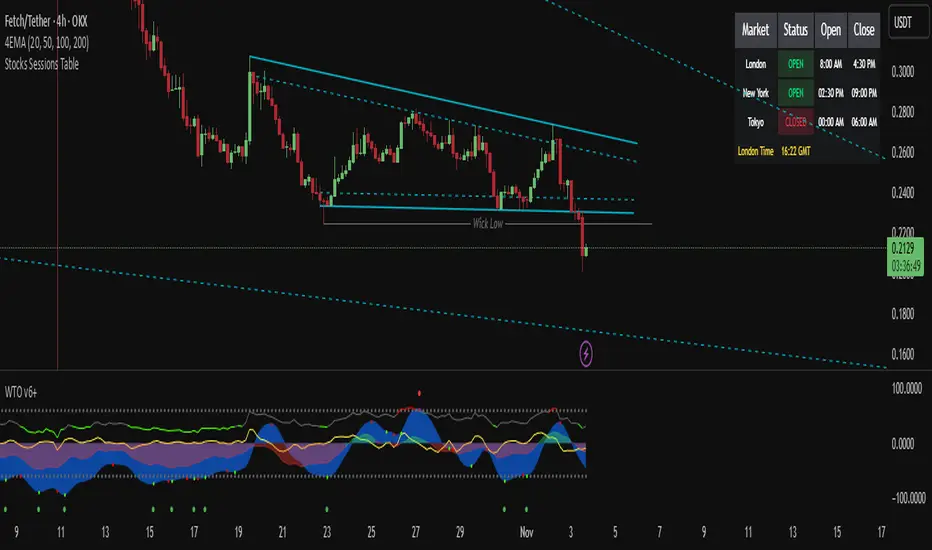
Stocks Sessions TableThe stock market open session table is a great way to keep an eye on the market's open and close. This is aimed at the UK traders working with the BST timezone
Strategy Sheet — Customizable 4x8 Table📖 Script Description
The Strategy Sheet — 4 Columns / 8 Rows is a compact and highly customizable table-based tool for traders who want to keep their trading plan, rules, and session settings directly visible on the chart.
🔹 Features:
• Up to 4 fully configurable columns and 8 rows
• Compact UI with per-column color overrides
• Dark / Light / Custom theme modes
• Support for zebra row backgrounds (alternating colors)
• Adjustable position, padding, spacing, and alignment
• Clean layout with borders and header styling
• Perfect for trade plans, ORB setups, session notes, or risk rules
🔹 Use cases:
• Documenting strategy rules directly on chart
• Displaying ORB session times and risk management
• Creating a structured overview of trading setups
• Quick reference without leaving the chart
This script does not generate signals – it’s a visual aid designed to organize and display trading information in a clear and professional way.

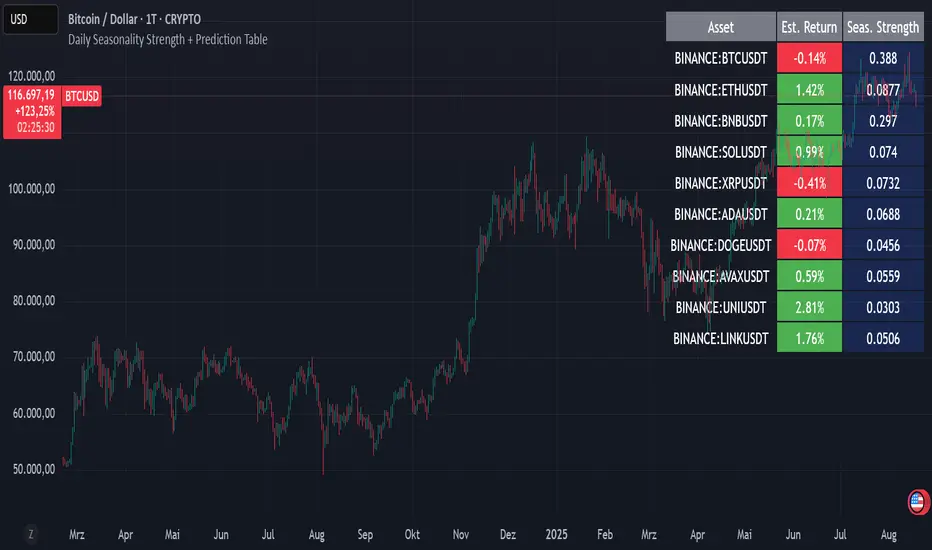
Daily Seasonality Strength + Prediction TableDaily Seasonality Strength + Prediction Table
Return Estimates:
This indicator uses historical price data to calculate average returns for each day (of the week or month) and uses these to predict the next day’s return.
Seasonality Strength:
It measures seasonality strength by comparing predicted returns with actual returns, using the inverse of MSE (higher values mean stronger seasonality).
supports up to 10 assets
This script is for informational and educational purposes only. It does not constitute financial, investment, or trading advice. I am not a financial advisor. Any decisions you make based on this indicator are your own responsibility. Always do your own research and consult with a qualified financial professional before making any investment decisions.
Past performance is no guarantee of future results. The value of the instruments may fluctuate and is not guaranteed
U Table • LITEA compact, educational version of my workflow that combines trend, momentum, trend strength, and a clean trigger:
Trend: EMA Fast vs EMA Slow (auto-lengths by chart TF)
Momentum: RSI > 50 for longs / < 50 for shorts
Strength: ADX above a user-set threshold (fallback implementation; can be replaced by ta.adx() when available)
Trigger: price crosses the Bollinger basis (center line)
Signals
LONG: crossover(close, BB basis) while EMA Fast > EMA Slow, RSI > 50, ADX > threshold
SHORT: crossunder(close, BB basis) while EMA Fast < EMA Slow, RSI < 50, ADX > threshold
Visuals
EMA Fast / EMA Slow / BB basis
Markers “L” / “S” on triggers
Latest confirmed pivot high/low (broken line style)
Small diagnostics table (ADX, EMA relation, RSI, last pivots) on the last bar
Inputs
Pivot length: pivot confirmation window (default 5)
ADX threshold: minimum trend strength to allow signals (default 20)
Notes
Signals are intended to be evaluated on bar close. Intrabar values may change until the bar closes.
Pivot lines appear after confirmation; they do not repaint once confirmed.
No external data or security() calls are used.
This LITE build focuses on clarity and speed (few calculations, overlay-friendly). It can be used as a stand-alone study or as a scaffold for your own research and risk management.

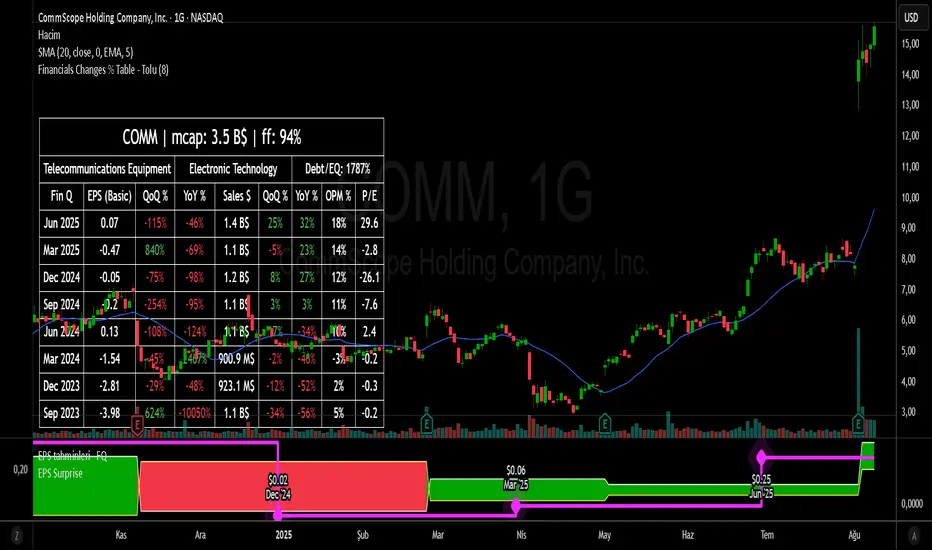
Financial Change % Table - ToluFinancial Change % Table which includes revenue , operating profit and earning per share . compares the financial data with previous quarter QoQ and previous year YoY . and shows the change in %.
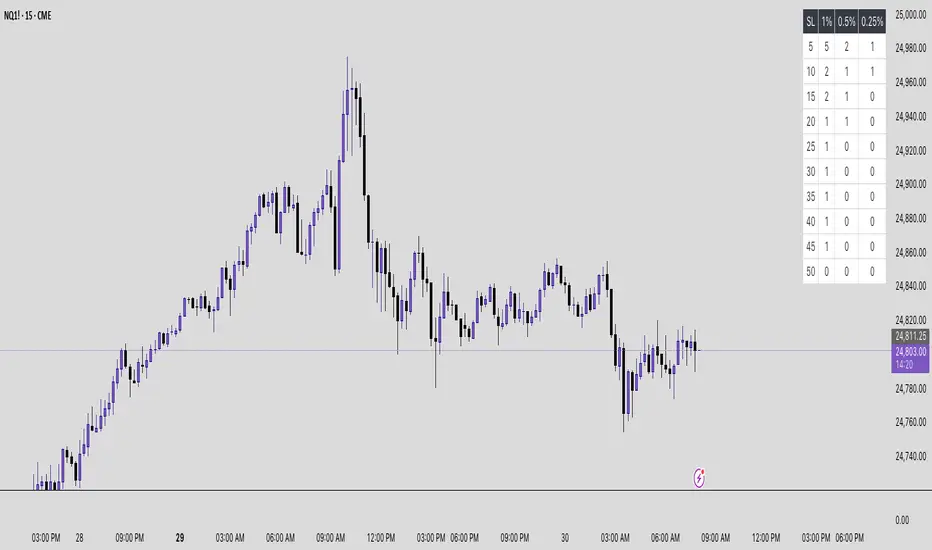
Position Sizing Risk TablePosition Sizing Risk Table - swing trading. Allowing for a 0,25; 0,5 and 1% risk based on NAV

Futures Risk Contract TableFutures risk table for NQ MNQ YM MYM ES and MES
changeable capital and risk percentage along with points.
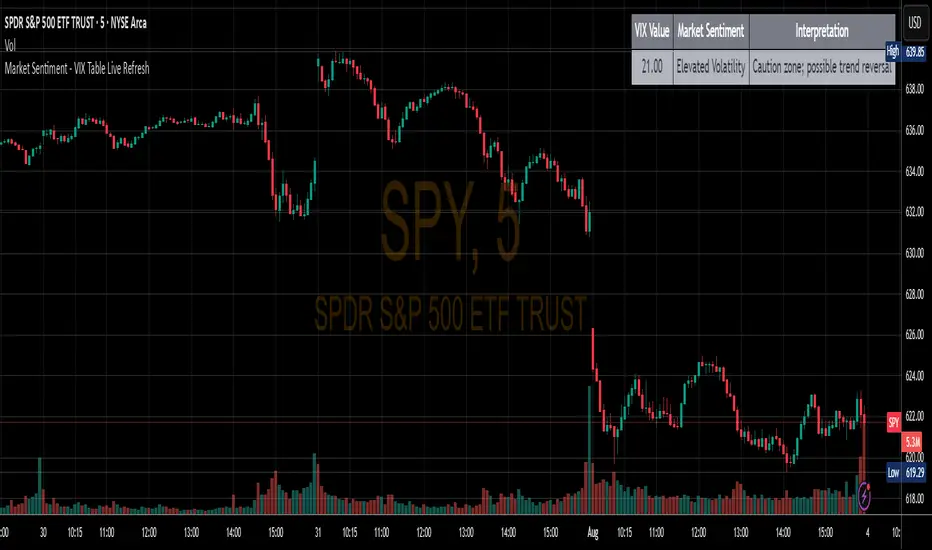
Market Sentiment - VIX Table Live RefreshProvides Market sentiment visual representation for easy understanding - using CBOE:VIX values
The VIX Sentiment Table provides an at-a-glance assessment of market mood by visualizing live data from the CBOE Volatility Index (VIX). Updated in sync with your chart’s resolution, this intuitive tool breaks down the current VIX level into clear sentiment zones—ranging from “Complacency” to “Panic”—paired with concise interpretations to guide your trading decisions.